
Introduction:
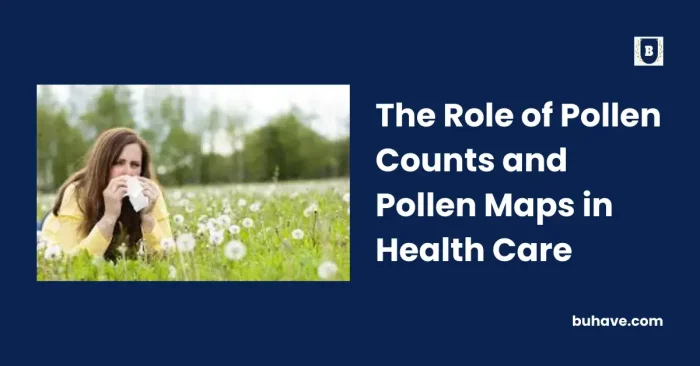
Pollen allergies, also known as hay fever or allergic rhinitis, affect millions of people worldwide. The presence of pollen in the air can trigger allergic reactions, causing symptoms such as sneezing, itching, congestion, and watery eyes. Managing these allergies remains crucial for individual well-being and public health, and advances in data analytics are helping clinicians and researchers make better decisions. In recent years, advancements in technology have led to the development of tools like pollen counts and pollen maps, which provide valuable information about pollen levels in specific areas. Biostatistics, the backbone of evidence-based healthcare, helps translate pollen data into practical guidance.
In this blog, we will explore the role of pollen counts and pollen maps in health care, highlighting their importance in understanding, managing, and mitigating the impact of pollen allergies.
Understanding Pollen Counts:
Pollen counts refer to the measurement of pollen grains present in a specific volume of air during a designated period. These counts are typically expressed as the number of pollen grains per cubic meter of air. By monitoring pollen counts, health care professionals can gain insights into the severity of pollen allergies in different regions and provide appropriate guidance and treatment options to patients. Pollen counts help individuals with allergies plan their outdoor activities and take necessary precautions to minimize exposure to allergens.
AI tools for disease prediction are increasingly used to model pollen exposure risks and forecast allergy outcomes in communities.
Pollen Maps: Visualizing Pollen Data
Pollen maps offer a visual representation of pollen counts in a particular area, often displayed on a geographic map. These maps provide an intuitive way to understand the distribution and concentration of pollen across different regions. By using colors or symbols, pollen maps help individuals identify areas with high or low pollen levels, allowing them to make informed decisions about where to travel, live, or spend time outdoors. Pollen maps are especially useful for people who are highly sensitive to specific types of pollen and need to avoid exposure to minimize allergy symptoms. In addition, pollen maps support decision-making in personalized health planning, as discussed in The Future of Personalized Medicine.
Personalized Pollen Data: Pollen Count by Zip Code
Pollen counts can be further customized to provide data specific to a particular location, such as pollen count by zip code. This level of granularity allows individuals to access detailed information about pollen levels in their immediate vicinity. Pollen count by zip code helps people plan their activities accordingly, whether it’s choosing a suitable time for outdoor exercise or identifying areas with lower pollen concentrations for temporary relief. Additionally, health care providers can use this information to offer personalized advice to their patients, tailored to their specific geographic location. This granularity also supports Reasons Why You Must Reach Out to a Community Health Advocate.
Allergy Forecasting and Early Warning Systems
Supporting Research and Public Health Initiatives:
Pollen counts and pollen maps also contribute to research and public health initiatives related to pollen allergies. Researchers can analyze long-term pollen data to identify trends, study the impact of climate change on pollen levels, and develop strategies to manage allergies effectively. Public health agencies can utilize pollen maps and counts to identify regions with higher prevalence of allergies and pollen-related health issues, directing resources and interventions where they are most needed. These data also inform biostatistical analyses that underpin health care decisions, such as those discussed in The Role of Biostatistics in Healthcare and its Importance for Advanced Practice Nurses.
Integration with Mobile Apps and Wearable Devices
To make pollen information easily accessible, many mobile apps and wearable devices now integrate real-time pollen data, including counts and maps. These apps provide users with personalized alerts, pollen forecasts, and information about pollen types prevalent in their area. By harnessing the power of technology and combining it with pollen data, these tools empower individuals to manage their allergies proactively and make informed decisions about their daily activities.
These mobile tools are increasingly complemented by AI-driven predictions described in AI tools for disease prediction.
Conclusion
Pollen counts and pollen maps play a crucial role in health care, particularly in managing and mitigating the impact of pollen allergies. These tools provide valuable information about pollen levels in specific areas, allowing individuals to plan their activities, take necessary precautions, and seek appropriate treatment.
By visualizing pollen data through maps and integrating it with mobile apps and wearable devices, pollen information becomes easily accessible and personalized. This alignment with personalized medicine is discussed in The Future of Personalized Medicine, which highlights how location-based health data can inform individualized care. Additionally, pollen counts and maps support research efforts and public health initiatives, enabling experts to study trends, issue forecasts, and direct resources where they are most needed. The continued advancement of technology and the availability of accurate pollen data empower clinicians and researchers to minimize the impact of pollen allergies on overall well-being and public health. Companies have already developed such tools to help their customers build better solutions using maps and data. Check out Ambee’s pollen maps page to get an instant overview of how pollen count affects certain areas and how you can avoid pollen to live healthily.
– If you are looking for guest posts in health “write for us” now.