Kandyse McClure
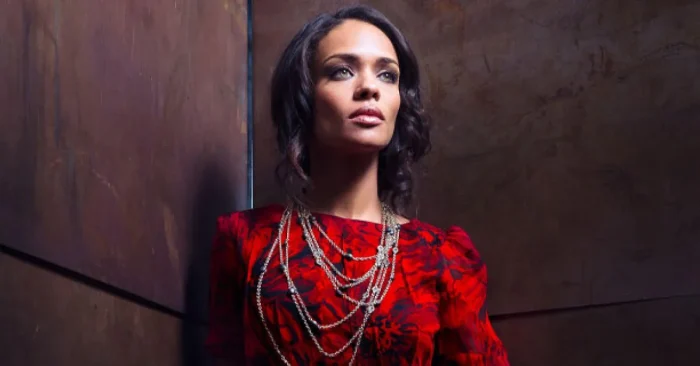
Kandyse McClure – Biography Early Life and Background Kandyse McClure was born on March 22, 1980, in Durban, South Africa. […]
Kandyse McClure – Biography Early Life and Background Kandyse McClure was born on March 22, 1980, in Durban, South Africa. […]
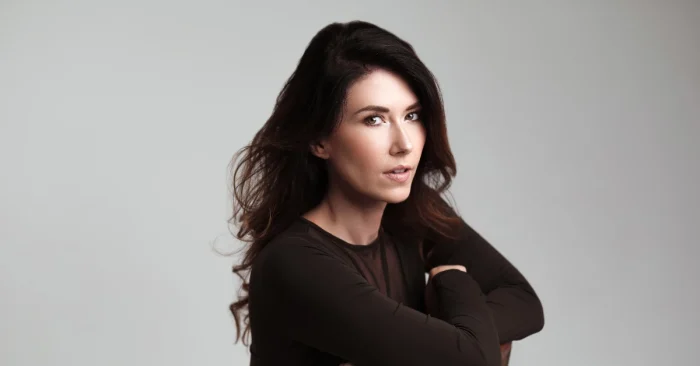
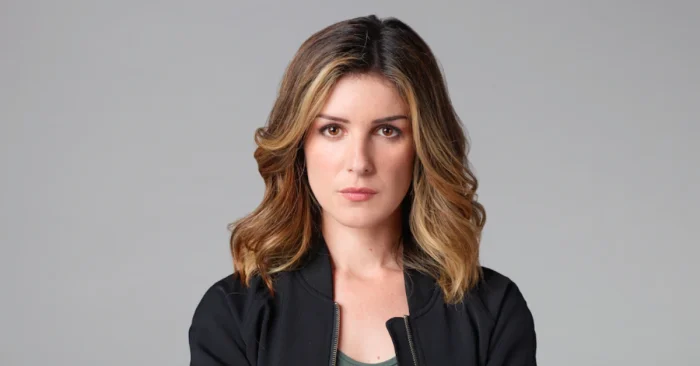
Jewel Staite – Biography Early Life and Background Jewel Staite was born on June 2, 1982, in White Rock, British
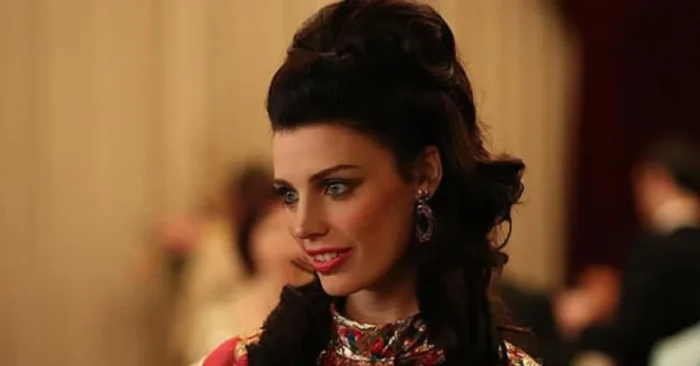
Jessica Paré – Biography Early Life and Background Jessica Paré was born on December 5, 1980, in Montreal, Quebec, Canada.
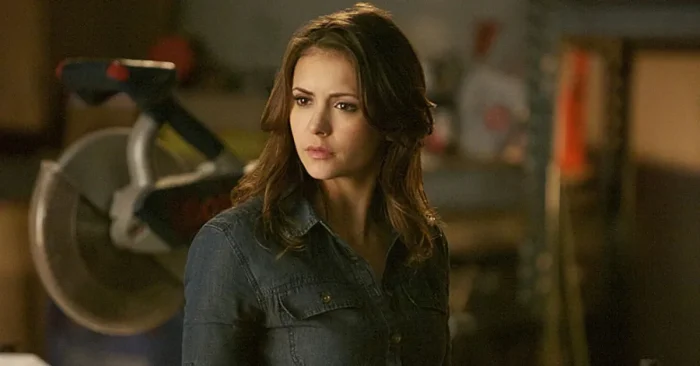
Nina Dobrev – Biography Early Life and Education Nina Dobrev was born on January 9, 1989, in Sofia, Bulgaria, and
Shenae Grimes – Biography Early Life and Background Shenae Grimes was born on October 24, 1989, in Toronto, Ontario, Canada.
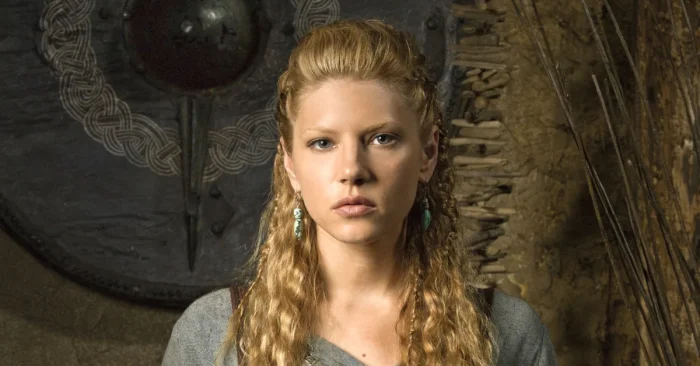
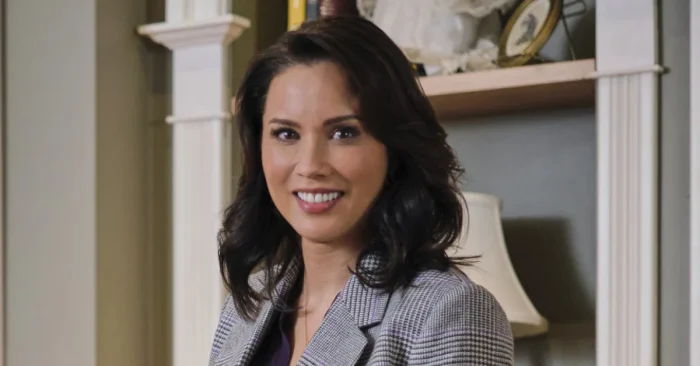
Katheryn Winnick – Biography Early Life and Background Katheryn Winnick was born on December 17, 1977, in Etobicoke, Ontario, Canada.
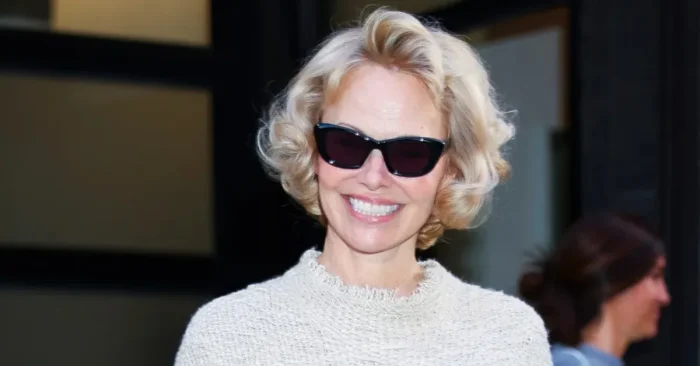
Pamela Anderson – Biography Early Life and Upbringing Pamela Anderson was born on July 1, 1967, in Ladysmith, British Columbia,
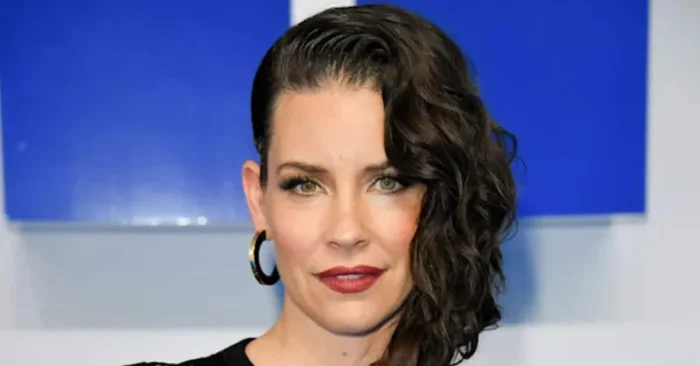
Evangeline Lilly – Biography Early Life and Background Evangeline Lilly was born on August 3, 1979, in Fort Saskatchewan, Alberta,
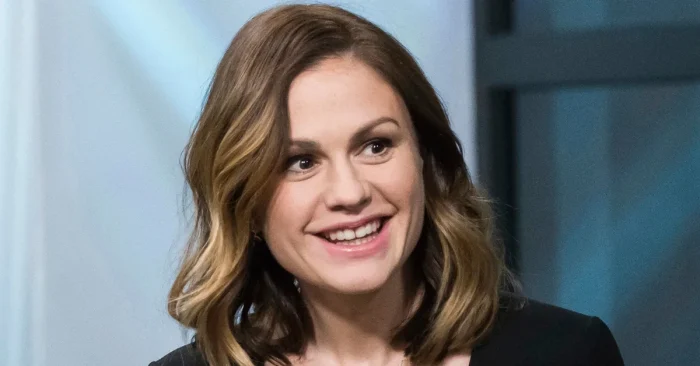
Anna Paquin – Biography Early Life and Background Anna Paquin was born on July 24, 1982, in Winnipeg, Manitoba, Canada.
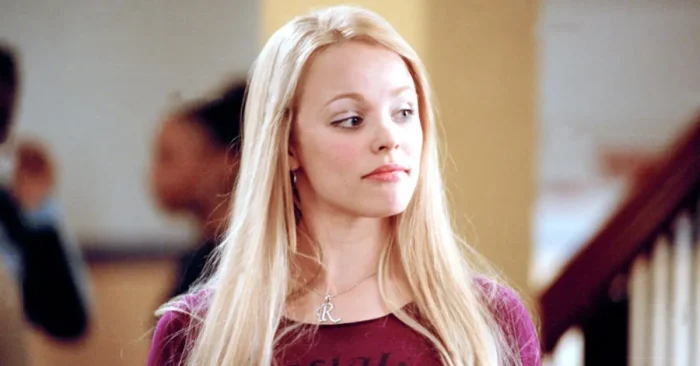
Rachel McAdams – Biography Early Life and Education Rachel McAdams was born on November 17, 1978, in London, Ontario, Canada.
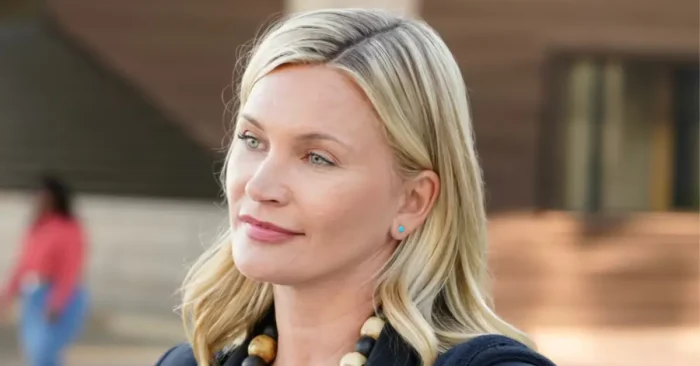
Early Life and Background Natasha Tonya Henstridge was born on August 15, 1974 in Springdale, Newfoundland and Labrador, Canada. She was raised